

Performance profiling is an incredibly powerful tool for developers, and it is not new; tools like Linux perf have offered profiling solutions since 2009. The first profiling tool, prof, was created for Unix in 1970! In spite of this, even modern programming languages sometimes lack quality tooling to gather performance profiles. Whether you need to investigate memory leaks or reduce the compute footprint of an application, instrumenting this kind of observability is often half the battle.
Developing profilers that work across programming languages is a difficult task, but this is where WebAssembly comes in. Being a compilation target for languages like Go, Rust, Kotlin, or C, and now capable of running server workloads thanks to wazero or wasmtime, we developed wzprof, a cross-language CPU and memory profiler for WebAssembly, laying the grounds for what could become a universal profiler.
In this post, we’ll take you on a deep dive into the internals of profiling, how we built wzprof, and how you can use it to profile your own programs!
When we were at Segment, dealing with performance challenges was part of our daily responsibility. No matter if we needed to reduce the footprint of our systems or reach the next scalability milestone, it was always about how to do more with less. Each and every time, the first tools we reached for were performance profilers.
Profilers come in two flavors: sampling and instrumenting. Sampling profilers usually record the call stacks of an application at a specific rate, then give you an approximated view of its behaviors. Instrumenting profilers work by mutating the application code or injecting routines at compile to create hooks for the measurements. They also tend to have a higher overhead.
Without going too much into the details, profiling an application happens in two steps:
WebAssembly runtimes are well-positioned to collect this data. Since they execute the guest code, they can automatically inject instrumentation and install hooks to record everything happening in the guest. They can also inspect the program memory, providing insight into its utilization and helping detect memory leaks.
To resolve the stack traces using debug symbols, WebAssembly modules carry DWARF sections. It is a debugging data format that contains a wealth of information about the structure of the program, and maps instructions generated by the compiler to the specific functions and lines of the original source code. This allows profilers to provide line-level profiling data, for example, to know exactly where in the original source code allocations occurred.
wzprof — pronounced as you think it should — is an instrumenting profiler built on wazero and the pprof data format. wzprof currently exposes two types of profiles: CPU and Memory.
We leverage the Google pprof format. However, thanks to WebAssembly, we are not limited to profiling Go programs; we can analyze programs in any language that compiles to WebAssembly, bringing the benefits of pprof to languages like Rust!
To install wzprof, you can download one of the release binaries, or install it from source with:
go install github.com/dispatchrun/wzprof@latestWe won’t cover the steps to compile a program to WebAssembly in this blog post, other articles such as this one are good resources already. Once you have a compiled .wasm file, you can run it with wzprof to generate performance profiles:
wzprof -memprofile /tmp/profile app.wasmAt this point, wzprof executes the WebAssembly program and outputs the recordings to the /tmp/profile file, then a tool like go tool pprof or compatible may be used to visualize the data:
go tool pprof -http :3030 /tmp/profileAnd for a long-running programs, wzprof can also expose the pprof endpoint on a http server:
wzprof -pprof-addr :6060 app.wasm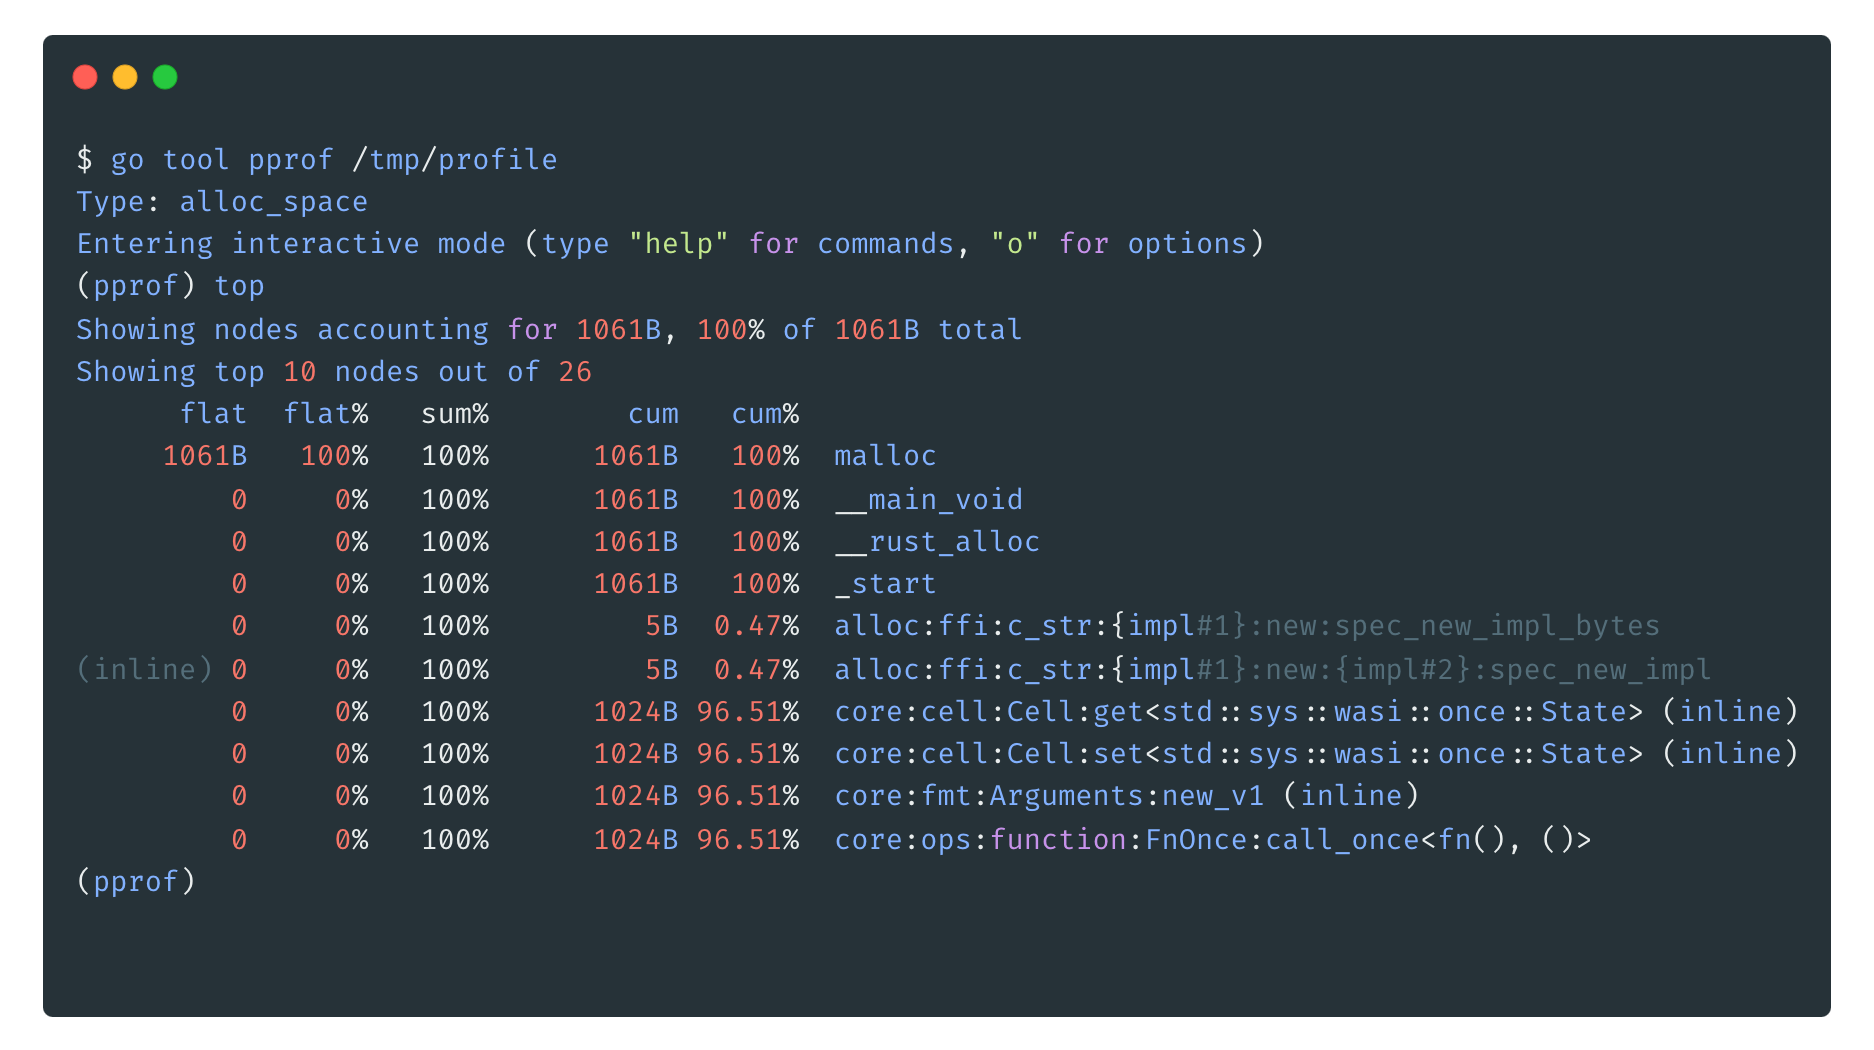
Because we use expose the profiles on pprof http endpoints, any continuous-profiler system supporting pprof profiles is compatible with wzprof. You could for example use tools like Parca from Polar Signals or Pyroscope from Grafana Labs.
That’s right. Use any pprof-compatible tool on any language that targets WebAssembly.
👉 Check out the repository at dispatchrun/wzprof!
Now that we’ve laid out the benefits of building a pprof-based profiler for WebAssembly, let’s deep dive into how it all works!
A classic design for profilers is to pause the program under observations at key moments and record the call stack, along with additional data surrounding it. In this post, we represent stacks with the first element at the bottom. For example, if func1 called func2, which called func3, the call stack looks like:

At a high level, in order to call a function in WebAssembly, first the caller needs to push the parameters of the function on the stack, then issue the call instruction. The callee considers the topmost values on the stack as its parameters (based on how many of them it expects). The values are moved into locals. When the callee finally returns, it has to end up with zero or more values on the stack, depending on how many values its type says it should return.
For example, let’s imagine a function f1 that needs to call a function f2 that takes two arguments and returns their sum. First f1 would push two values on the stack. Then call f2, which would then read the two locals and push their sum on its stack. f2 then returns control to f1, with the result of the computation on top of the stack.

This stack is virtual, meaning it’s up to the WebAssembly virtual machine (the host) to choose how to actually represent it. It could be one array, multiple-linked lists, anything goes, as long as the semantics are respected.
The wazero compiler engine that wzprof is built upon uses an array of uint64 elements to represent the WebAssembly stack. It contains local values and call frames.
A call frame contains the caller’s return address, the caller’s base pointer, and a pointer to an internal construct that provides more details about the function itself (such as type information).
For example, if the VM is currently executing a function func2, called by func1, with arguments a0, a1, a2, and func2 has the local variables v1, v2, the stack would look like this:

This layout is a critical piece of wazero and wzprof. With proper instrumentation, it allows us to efficiently take a snapshot of the call stack to profile what the WebAssembly program is doing.
To take a snapshot of the call stack, we need to somehow stop the WebAssembly program. In interpreter mode it is straightforward: the interpreter can decide to snapshot the call stack in between executing any instruction. With the compiled code it is a bit different: when a compiled function executes, the control flow is moved to the native code, and the host gets control back whenever the function returns. Fortunately, wazero provides the Listener API. Essentially, it allows us to provide a callback before and after the execution of each WebAssembly function, we are interested in. The callbacks signatures look like this:
Before(context.Context,            // Go-style execution context
       api.Module,                 // Detailed information about the module
       api.FunctionDefinition,     // Details of the function about to be executed
       []uint64,                   // Function's arguments
       **experimental.StackIterator**) // :)
When our callbacks are invoked, we can then use our knowledge of the stack layout described above to retrieve detailed information about the call stack. This led us to build the [StackIterator](https://pkg.go.dev/github.com/tetratelabs/wazero@main/experimental#StackIterator) feature. As its name indicates, it allows us to snapshot the stack when a function we are interested in is called. For example:
// One iteration of the loop per frame on the call stack.
for stackIterator.Next() {

    // Learn about the function definition, such as its types.
    function := stackIterator.Function()

    // Retrieve the value of the arguments the function was
    // called with.
    parameters := stackIterator.Parameters()

    // Know where in the WebAssembly Code section the function
		// call occurred. Used for source mapping.
    offset := function.SourceOffsetForPC(stackIterator.ProgramCounter())

		...
}
function and parameters are basic call information. offset allows us to perform source mapping (for example to provide human-readable names for functions, or tell which specific source line allocated memory). This will be the topic of another blog post.
Using the function information pointer (which contains things like the signature of the caller) and the base pointer, the stack iterator moves from one stack frame to another by looking into the WebAssembly stack at index base pointer + count of function.arguments , which would be the beginning of the next frame of the caller. Iterate over and over until the base pointer is zero.

(technically we also have to account for potentially reserved space for return values, but it works just the same and is omitted here for clarity)
The StackIterator is used at the core of wzprof to offer CPU and memory profiling of WebAssembly guests!
When looking at CPU profiles, you either want to see how much time a certain function takes to be executed or the overall proportion of time that function takes within the entire program execution.
wzprof offers two types of CPU profiling: CPU samples and CPU time. The CPU samples profiler counts the number of times each stack is getting executed. To accomplish this, we create a hash during the stack unwinding process and count the number of occurrences of each unique stack.
The CPU time profiler is a bit different. We record the actual execution time of each leaf function for each call stack and sum it up using the same hashing mechanism used by the CPU samples. We then remove the time spent doing I/O operations to give you the actual time spent on the CPU for each function. We currently consider all time spent in host-functions as I/O wait, which is a good enough approximation since most host calls will complete quickly unless they are waiting on I/O operations.
When profiling CPU time, it is critical for the measures to have a minimal impact on the program. Thanks to a high performance sampling mechanism, our benchmark have indicated that we were usually able to keep the overhead under 10% of the overall CPU utilization.
While in our case CPU profiling is rather straightforward, providing useful memory profiles of a WebAssembly module is a touch harder.
The built-in way for a WebAssembly module to request more memory is memory.grow. This function grows the memory instance by a fixed number of 64KiB pages. While it is the WebAssembly way of asking for more memory, reporting its invocations is of little use to the programmer. The really interesting information is provided by the language runtime memory allocator of the WebAssembly module. That allocator can have multiple shapes depending on the runtime that was compiled in the module. For example, the malloc -family functions constitute a common allocator for C, rust, and friends; and the Go runtime uses runtime.mallocgc.
Though this brings us down the path of special-casing various languages and the functions they use, a surprisingly small amount of them is required to provide insights into the memory allocations of today’s WebAssembly programs!
In addition, those functions all tend to have the same signature, making it easy to define them by the way they accept the requested amount of bytes from the user:
malloc(<size>) // request <size> bytes
realloc(..., <size>) // request <size> bytes
runtime.mallocgc(<size>) // request <size> bytes
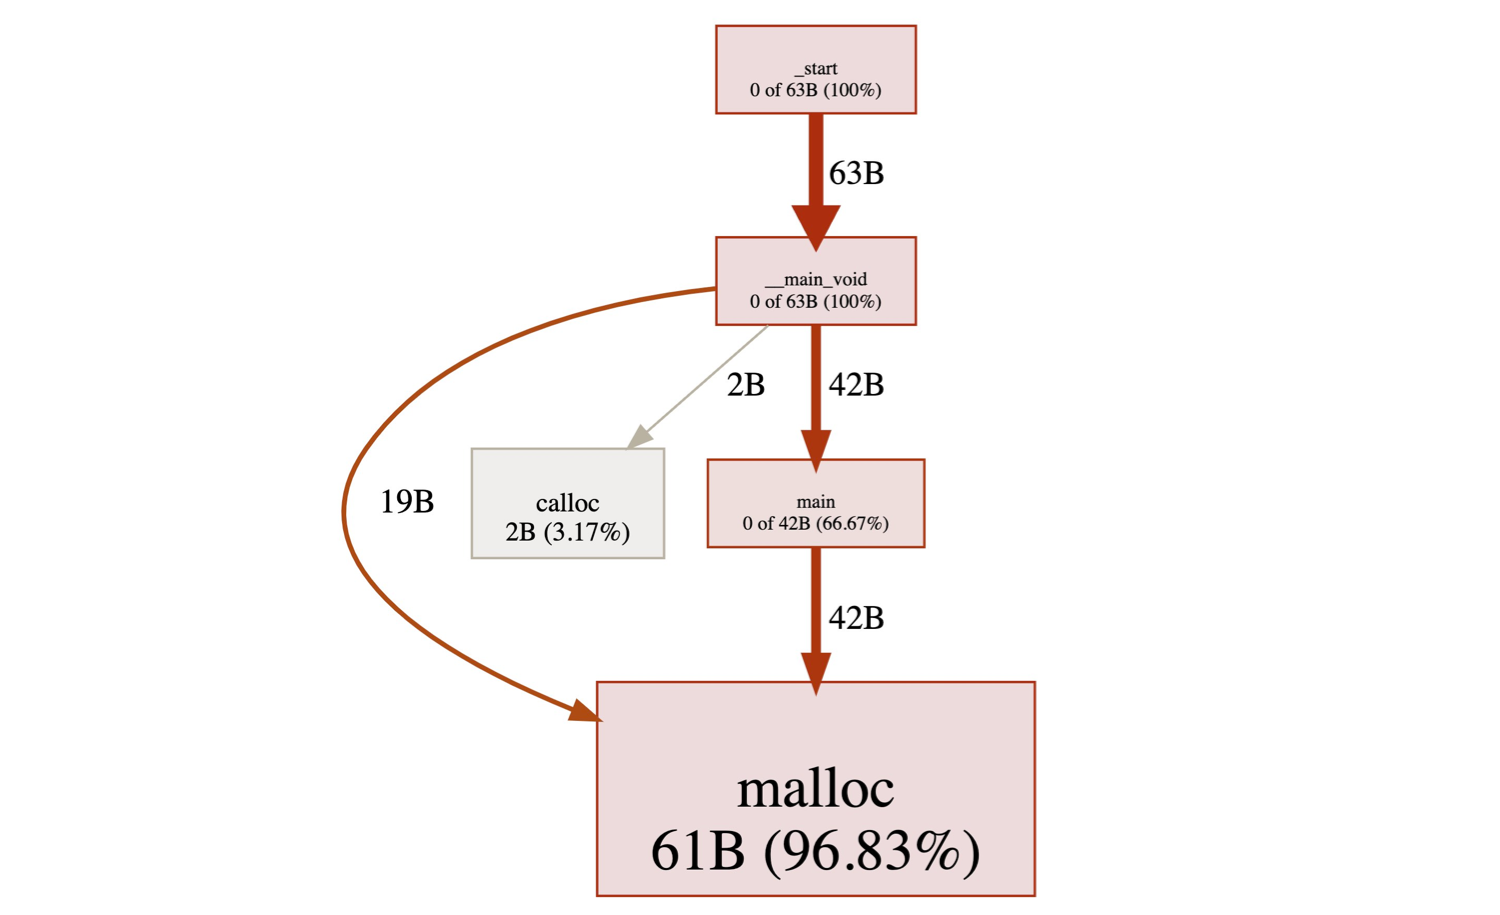
// ... and so on!For example, we attach a callback to the malloc function. StackIterator retrieves the first (and only) argument to malloc to know how many bytes were requested and snapshots the rest of the stack to reflect what chain of function calls resulted in this allocation.

As we instrument those function calls with wazero’s experimental.FnctionListener API, we have handy access to the parameters those functions were called with. Figuring out the requested bytes is a matter of picking the right argument, and casting it to the right type. As new languages and runtimes get traction in the world of WebAssembly, it is also easily extendable.
However, tracking the Go runtime’s memory allocation was more challenging.
(Note that the following behavior concerns golang/go, not tinygo.)
Rust, C, zig, all those languages call WebAssembly functions the standard way: by pushing arguments onto the stack, maybe reserving some return space, then calling the desired function. Easy for us.
Except, Go doesn’t quite work that way. The Go garbage collector needs to introspect the stacks of its goroutines to correctly track the objects they reference. Unfortunately, the WebAssembly specification does not yet allow a WebAssembly module to introspect its stack. As a result, the Go developers have opted to store the stack in linear memory.
In WebAssembly, “the stack” refers to the stack of the stack machine as described above. It is completely separate from the linear memory that most people are familiar with. So, to be able to walk the stack from within, Go programs compiled to GOARCH=wasm actually write their goroutine stacks to a region of the linear memory. Go uses the VM stack with only one parameter to implement continuations (which is outside of the scope of this post).
To implement the instrumentation of Go’s runtime.mallocgc function, we now know that we must retrieve its argument from the module’s memory. But where? Scanning the whole memory looking for something that resembles a goroutine stack would be impractical. Thankfully, the Go runtime also maintains the address of the top of the stack in the global variable 0. The whole process now becomes:
runtime.mallocgc.global 0.runtime.mallocgc: the number of requested bytes.Here is an example, where runtime.mallocgc is instrumented. The main funcion calls func1, which eventually calls runtime.mallocgc through make (skipping over the internals of make for simplicity, but see it as an allocation of 53 bytes here). At the moment runtime.mallocgc is called, the top of the stack is at address 0x1234. Go places the return address as the first element of that stack, then the argument for the callee. So we perform a memory read at 0x1234 + 1*sizeof(uint64), which gives us the first argument passed to runtime.mallogc: the number of bytes to allocate that we are looking for.

Note how the WebAssembly stack is not used to retrieve the function arguments anymore. It is still used to capture the call stack and correctly report in the pprof profile which functions are responsible for allocating, allowing it to generate the call graph.
wzprof is a major step forward in bringing the capabilities of Go pprof to any programming language compiling to WebAssembly. It enables profiling guest applications, but could it do more?
Could profiling be done in-depth from the guest, through calls to host functions, down to the kernel syscalls — and will this be where native profilers using pprof or eBPF cross paths with WebAssembly?
These are some of the many opportunities we are excited about, as we continue to explore the possibilities unlocked by building software with WebAssembly. As for next steps, we are looking at how to enable profiling for interpreted language runtimes like Python. But first, we are excited to release wzprof and hope it will be useful to you!
If you want to stay in touch or learn more about our journey at dispatch.run, follow us on Twitter or reach out to hi@stealthrocket.tech!
We want to extend special thanks to Alexandra Noonan, Calvin French-Owen, Edoardo Vacchi, Jean-Denis Greze, Lauren Reeder, and Victor Hiairrassary for their review and feedback on wzprof and this post!
We also want to add a special mention for the Wazero team at Tetrate, who has been extremely supportive and created the foundation that made all of this possible!
Join the community, sign up and start building.